

Here's an interesting idea: instead of measuring the similarity of two black and white images by counting the number of identical pixels, group the pixels randomly into pairs and count the number of identical pairs.

Once you have defined this alternative similarity measure, you can perform nearest-neighbor regression in the space of coupled pixels.
As it turns out, this method recognizes the handwritten digits in the MNIST data set with about 96.4% accuracy. You can verify that by running the following experiment yourself:
import numpy as np
from tqdm import tqdm
from sklearn.datasets import fetch_openml

# fetch the data and select a train/test split:
mnist = fetch_openml("mnist_784", as_frame=False)
ntotal, imsize = mnist.data.shape
order = np.random.permutation(ntotal)
x = mnist.data[order,] >= 128  # i.e., to bool
y = mnist.target[order,].astype(np.uint8)
xtest, xtrain = np.split(x, [ntotal // 10])
ytest, ytrain = np.split(y, [ntotal // 10])

# compute the random embedding:
npairs = imsize // 2
idx = np.random.choice(imsize, replace=False, size=(npairs, 2))
etrain = np.sum(xtrain[:, idx] * (1, 2), axis=2).astype(np.uint8)
etest = np.sum(xtest[:, idx] * (1, 2), axis=2).astype(np.uint8)

# evaluate the nearest-neighbor accuracy:
yhats = []
for et, yt in tqdm(zip(etest, ytest), total=len(etest)):
    scores = np.sum(et == etrain, axis=1)
    yhats.append(ytrain[np.argmax(scores)])
print("Accuracy: %.1f pct" % (100 * np.mean(yhats == ytest),))
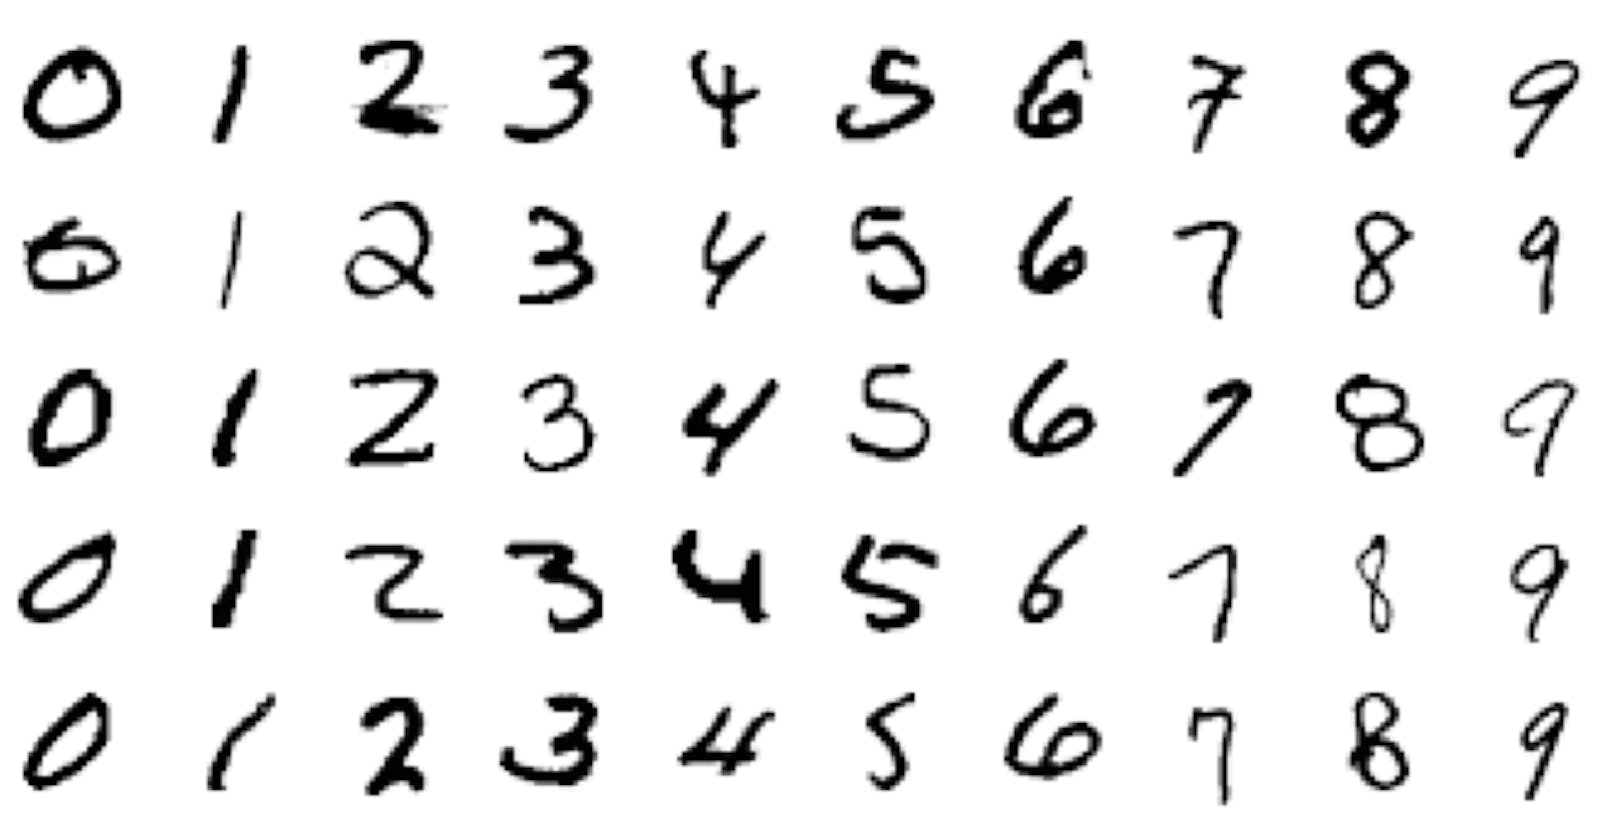
Here is a matrix of images that illustrates the behavior of this method:
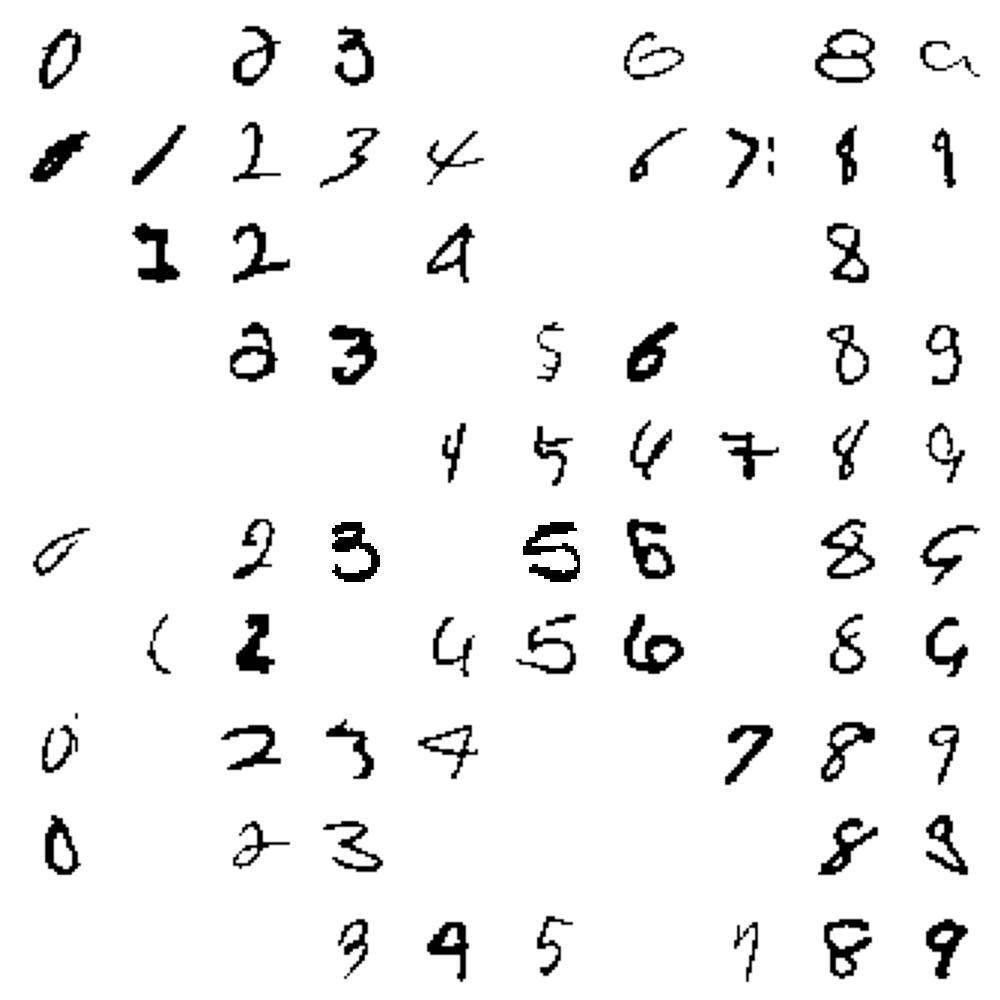
The columns contain images that are labeled 0, 1, 2, ..., 9, and the rows contain images that are categorized as 0, 1, 2, ..., 9.
Here is a table of categorization counts for the validation set (which I will paste as raw text since Hashnode has terrible table-formatting options):
  |   0 |   1 |   2 |   3 |   4 |   5 |   6 |   7 |   8 |   9 |
--|-----|-----|-----|-----|-----|-----|-----|-----|-----|-----|
0 | 692 |   0 |   9 |   1 |   0 |   0 |   2 |   0 |   4 |   1 |
1 |   0 | 781 |   7 |   2 |  10 |   1 |   5 |   8 |  12 |   2 |
2 |   0 |   0 | 723 |   3 |   0 |   0 |   0 |   2 |   4 |   0 |
3 |   0 |   0 |   2 | 663 |   0 |  14 |   0 |   1 |   9 |   6 |
4 |   0 |   0 |   0 |   0 | 697 |   2 |   0 |   4 |   3 |  17 |
5 |   2 |   0 |   4 |  15 |   0 | 570 |   1 |   0 |  17 |   0 |
6 |   4 |   0 |   1 |   0 |   1 |   6 | 639 |   0 |   4 |   0 |
7 |   2 |   2 |   9 |   5 |   3 |   1 |   0 | 697 |   4 |  18 |
8 |   0 |   0 |   2 |   2 |   1 |   0 |   0 |   0 | 635 |   2 |
9 |   0 |   0 |   1 |   3 |  13 |   6 |   0 |   3 |   4 | 636 |
The table reveals that the most common error is to mistake the digit 9 for a digit 7, which makes some sense visually.
This idea comes from a 1959 paper called "Pattern Recognition and Reading by Machine," which I came across when researching some of the prehistory of neural networks. An identical idea was later taken up by a British research group which applied it to computer vision for robotics, but their work appears to have fizzled out without ever finding any wide purchase. Oddly enough, though, the concept seems to have had a bit of an afterlife in game theory under the name of the N-tuple bandit.